If ever there was a breast cancer cell line that highlighted the inportance of taking every cell line and indeed every patient as an individual, regardless of the tissue of origin of the cancer, it is the DU4475 cell line. This cell line was established from a metastatic skin nodule of a 62 year old Caucasian patient previously diagnosed with breast carcinoma. Thus, this cell line is considered to be a metastatic breast cancer cell line. The STR profile for this cell line along with other genomic data sets pertinent to the line can be found here at Cellosaurus, or here at COSMIC, or here at DepMap portal. Interestingly, DepMap Portal lists this cell line as a ER negative, HER2 negative sub-lineage, and belonging to the Luminal HER2 amplified molecular subtype. As you will see below, these designations are not helpful when it comes to understanding the driving oncogenes and drug sensitivities of this cell line.
Oncogene Signature: The first thing that jumps out from the Oncogene Signature is the classic V600E point mutation in the BRAF oncogene. This gene was a strong hit in the functional screen and thus is clearly the driving oncogene in this cell line. It is also of interest that these cells have a fairly common point mutation in the APC gene, though this gene was not a hit in the screen. These are highly unusual oncogenes in breast cancer, and it may be of interest that the line was derived from a skin nodule. Beyond these two genomic alterations that are commonly found in melanoma and colon cancer, it is noteworthy that AKT3 is highly overexpressed in these cells, though not a screen hit. None of the other candidate oncogenes that have genomic alterations in this cell line were close to being considered essential in the CRISPR screen.
| Gene | CRISPR score | Demeter score | Log fold change | DNA amp | mutation | occ. In Cosmic |
| BRAF | -1.727350736 | 0.582018108 | 0.3687 | p.V600E | 15808 | |
| TRAF5 | -0.208639383 | 2.565234805 | 1.0121 | |||
| AKT3 | -0.174822526 | 3.920049258 | 1.0399 | |||
| ELF3 | -0.168265832 | -5.907015815 | 1.0121 | |||
| SMYD3 | -0.153635556 | 3.645100089 | 1.0399 | |||
| H3F3A | -0.095713946 | 1.555768669 | 1.0009 | |||
| IKBKE | -0.023055685 | 1.004282124 | 1.0121 | |||
| PARP1 | 0.233990615 | 1.62738237 | 1.0009 | |||
| APC | 0.266543708 | -0.912353408 | -1.134 | p.E1577* | 22 |
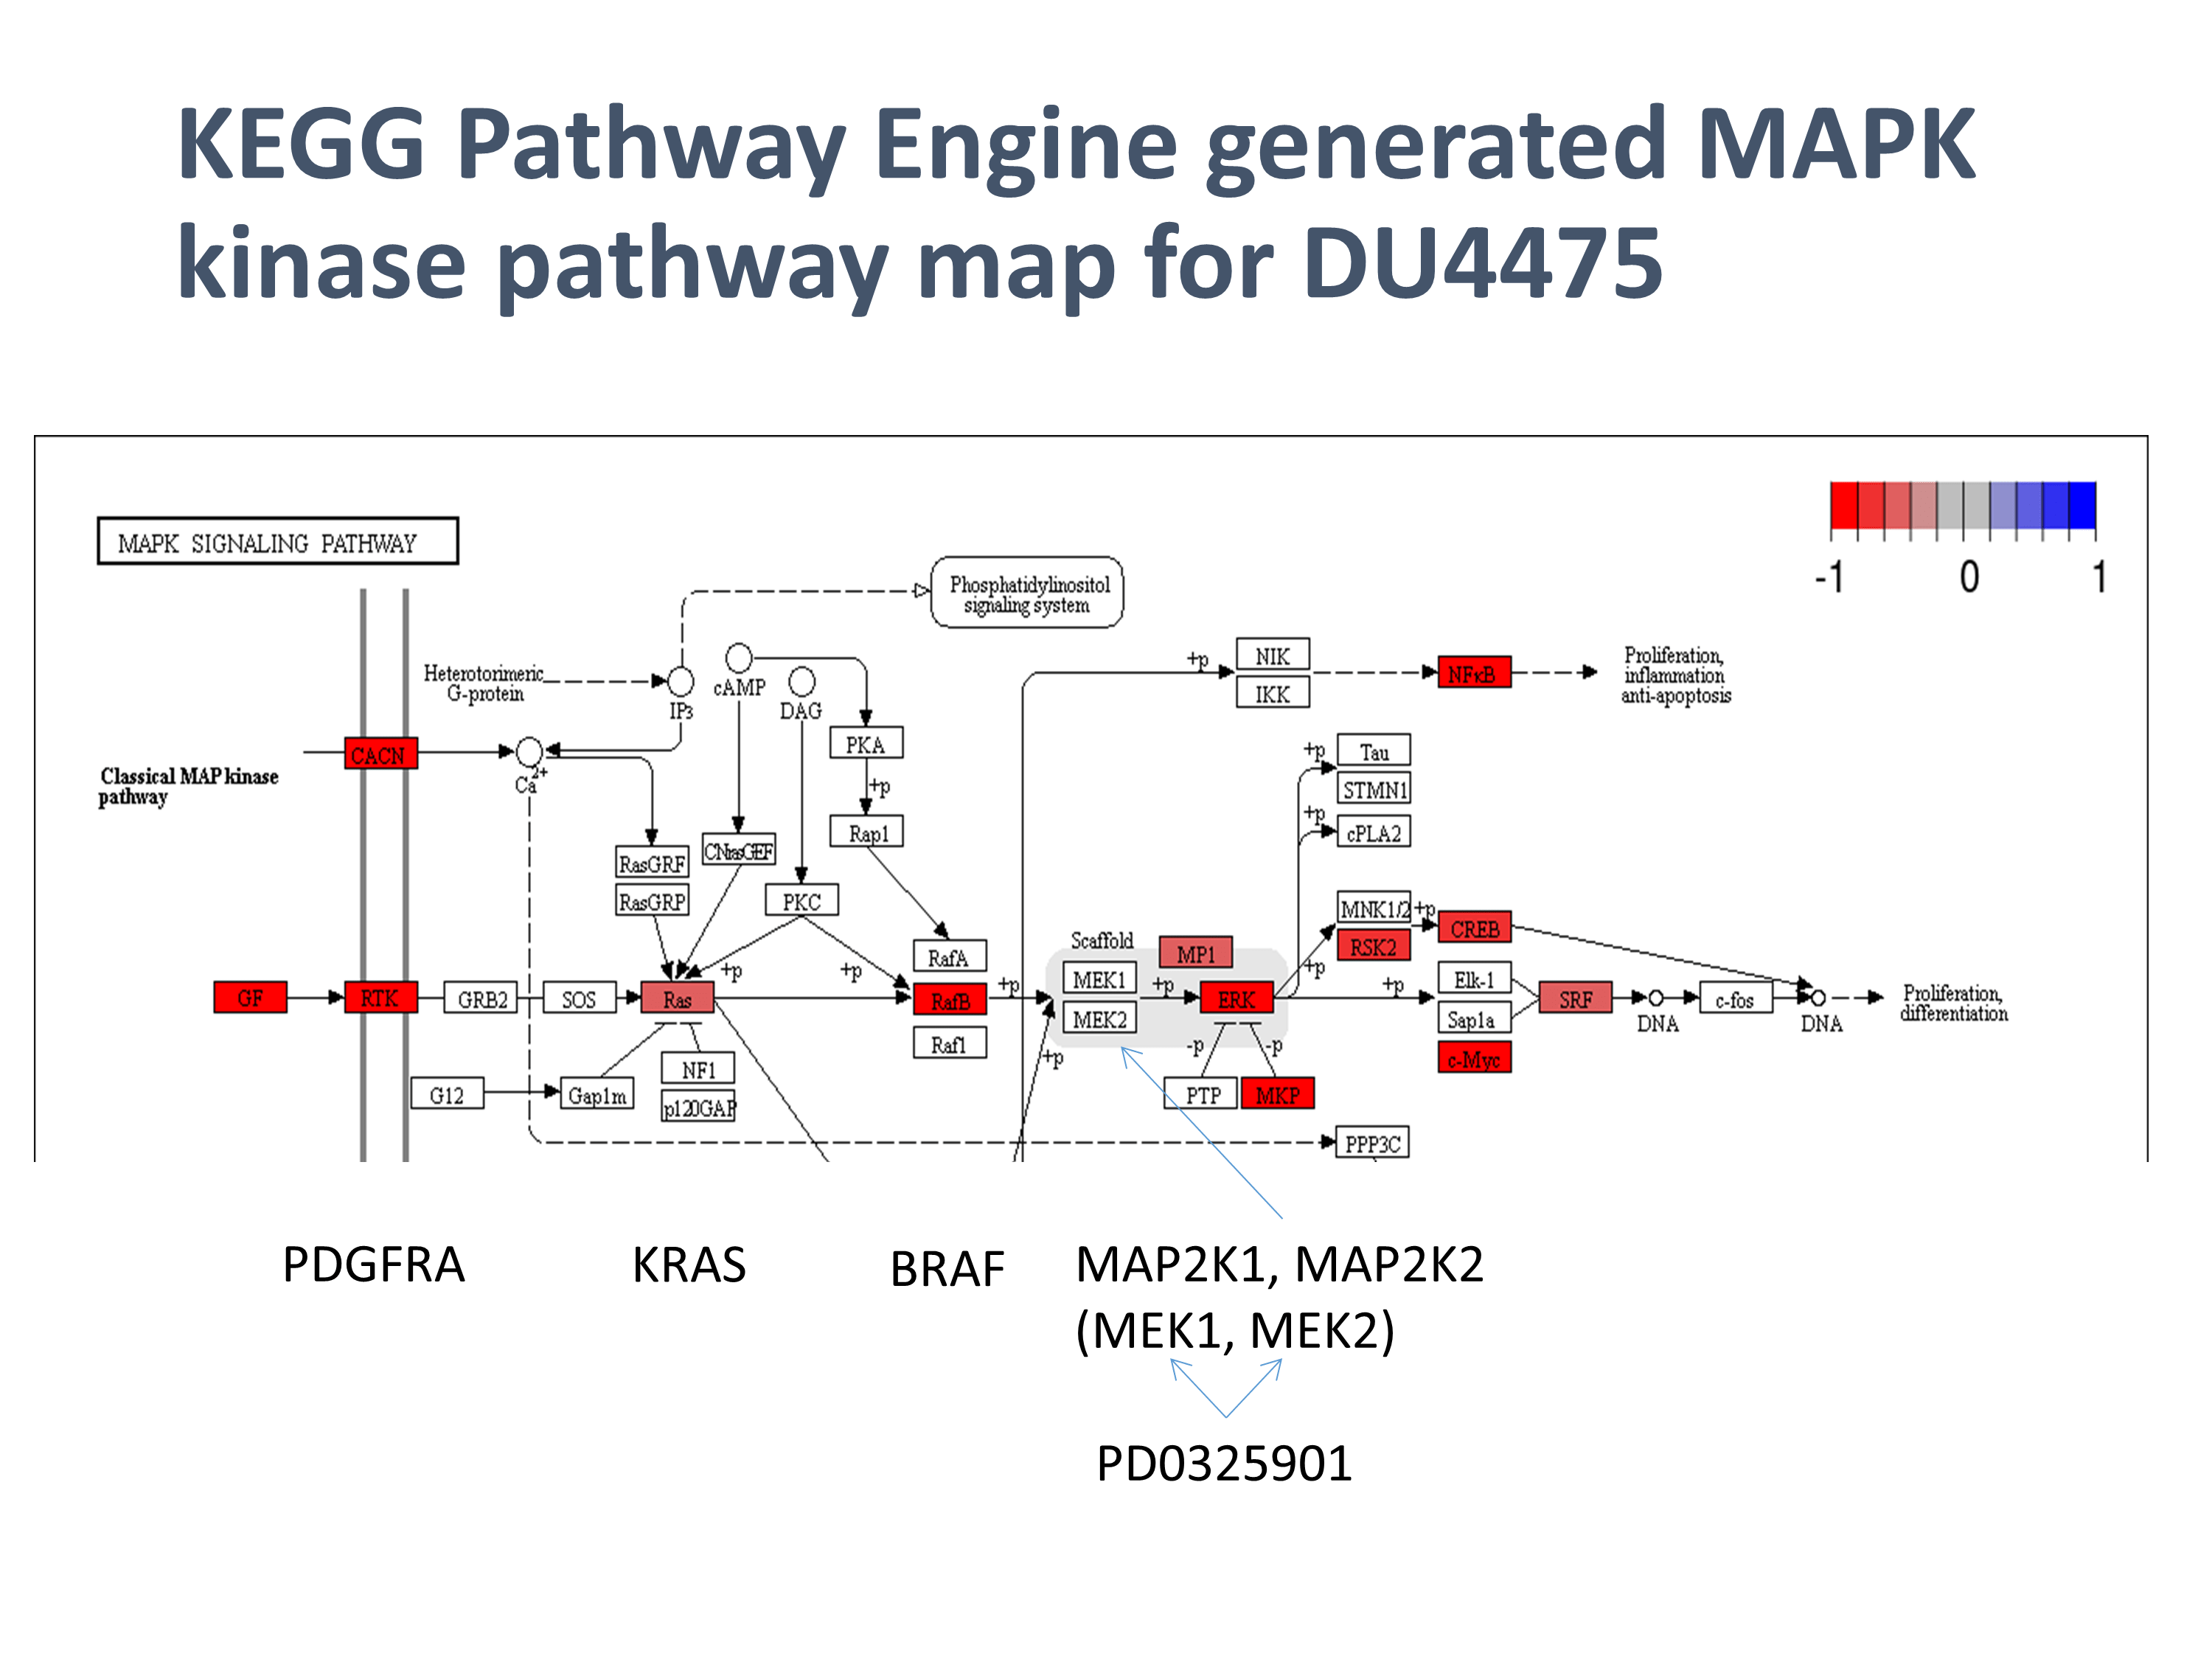
Signature of best druggable targets in this cell line: There are several very interesting features of the druggable signature for this breast cancer cell line (or is it?) some, but not all of which are related to having mutant BRAF as the driving oncogene. First, it is immediately obvious that these cells are exquisitely sensitive to several BRAF targeted drugs, particularly PLX-4720 which is now better known as vemurafinib. Thus, mutant BRAF is a classic functional druggable oncogene. It is also interesting that the cells are also highly sensitive to two drugs that target MAP2K1 and MAP2K2 but that neither of these genes were screen hits. There are several lines of evidence to indicate that these drug sensitivities are correct and are related to the mutant BRAF oncogene. First, as can be seen from the LFC column, both genes are expressed in this cell line at about the same level. Now, referring to the KEGG pathway for these cells shown below, one can see that these proteins have redundant function and lie between BRAF and ERK in the MAPK pathway. Thus, whereas the screens are able to reduce the expression of only one gene at a time, some drugs are able to target both family members effectively. Thus, one would predict, given the other evidence, that the cells would be highly sensitive to this drug, which blocks immediate downstream signaling from the mutant BRAF. In addition to the drug sensitive targets related to the mutant BRAF oncogene, there are several genes in the apoptosis pathway that were hits in the screen, namely BCL2L1 and MCL1, and accordingly, these cells are sensitive to several drugs that target these genes. Thus, in this cell line, there is once again, ample potential to combine oncogene or oncogene pathway targeted drugs with BH3 mimetic drugs, which based on past experience, would be predicted to induce synergistic cell death following low doses of drug.
| DU4475.Tier1 | ||||||||
| Drug name | Gene symbol_HGNC | z_score_GDSC1 | z_score_GDSC2 | DNA_amp | lfc | mutation | COSMIC_hit | |
| Dabrafenib | BRAF | -3.461211 | -4.145031 | 0.3687 | 0.582018108 | p.V600E | 1 | |
| PLX-4720 | BRAF | -3.974495 | -3.288462 | 0.3687 | 0.582018108 | p.V600E | 1 | |
| Olaparib | PARP1 | -0.916673 | -1.741401 | 1.0009 | 1.62738237 | NULL | 0 | |
| Niraparib | PARP1 | 0 | -1.626684 | 1.0009 | 1.62738237 | NULL | 0 | |
| AZ628 | BRAF | -2.807417 | 0 | 0.3687 | 0.582018108 | p.V600E | 1 | |
| SB590885 | BRAF | -4.41058 | 0 | 0.3687 | 0.582018108 | p.V600E | 1 | |
| DU4475.Tier2 | ||||||||
| Drug name | Gene symbol_HGNC | z_score_GDSC1 | z_score_GDSC2 | DNA_amp | mutation | lfc | achilles_score | demeter |
| WEHI-539 | BCL2L1 | 0 | -3.505726 | 0.0417 | NULL | -0.614301461 | -1.816590803 | NULL |
| ABT737 | BCL2 | 0 | -2.99367 | -0.4467 | NULL | 1.387803208 | -0.532011853 | NULL |
| ABT737 | BCL2A1 | 0 | -2.99367 | 0.0131 | NULL | 6.292885906 | -0.996132321 | NULL |
| ABT737 | BCL2L1 | 0 | -2.99367 | 0.0417 | NULL | -0.614301461 | -1.816590803 | NULL |
| Tozasertib | AURKA | -0.329408 | -2.526678 | 0.0423 | NULL | -0.390751163 | -1.397145279 | NULL |
| Tozasertib | AURKB | -0.329408 | -2.526678 | -0.0191 | NULL | 0.600280425 | -1.292795471 | NULL |
| RO-3306 | CDK1 | -0.421263 | -2.218674 | 0.3609 | NULL | 0.616276421 | -1.782839183 | NULL |
| Entinostat | HDAC3 | -1.267387 | -2.205466 | 0.0542 | NULL | 0.270827125 | -1.581762288 | NULL |
| LJI308 | RPS6KA1 | 0 | -2.059636 | -0.0034 | NULL | 1.298533522 | -0.647991739 | NULL |
| Axitinib | PDGFRA | -0.139564 | -1.765024 | 0.0446 | NULL | 0 | -0.564642508 | NULL |
| JQ1 | BRD2 | -0.810683 | -1.500408 | -0.0526 | NULL | -0.242788536 | -1.130520866 | NULL |
| JQ1 | BRD4 | -0.810683 | -1.500408 | -0.0156 | NULL | 1.289661134 | -1.145723129 | NULL |
| Alisertib | AURKA | -2.062328 | -0.274104 | 0.0423 | NULL | -0.390751163 | -1.397145279 | NULL |
| XMD14-99 | CDK7 | -2.017441 | 0 | 0.0644 | NULL | 0.006759802 | -2.034821471 | NULL |
| AZ628 | BRAF | -2.807417 | 0 | 0.3687 | p.V600E | 0.582018108 | -1.727350736 | NULL |
| SB590885 | BRAF | -4.41058 | 0 | 0.3687 | p.V600E | 0.582018108 | -1.727350736 | NULL |
| SL0101 | AURKB | -2.53603 | 0 | -0.0191 | NULL | 0.600280425 | -1.292795471 | NULL |
| DU4475.Tier3 | ||||||||
| Drug Name | Gene SymbolHGNC | z_score_GDSC1 | z_score_GDSC2 | DNA_amp | lfc | mutation | achilles_score | demeter |
| SCH772984 | MAPK3 | 0 | -3.243074 | 0.0032 | -0.350073519 | NULL | -0.122930226 | NULL |
| PD0325901 | MAP2K1 | -2.352646 | -3.128407 | -0.0647 | 0.385986599 | NULL | -0.251666558 | NULL |
| PD0325901 | MAP2K2 | -2.352646 | -3.128407 | -0.0044 | 0.354334418 | NULL | -0.211672308 | NULL |
| Trametinib | MAP2K1 | -2.112662 | -2.943476 | -0.0647 | 0.385986599 | NULL | -0.251666558 | NULL |
| Trametinib | MAP2K2 | -2.112662 | -2.943476 | -0.0044 | 0.354334418 | NULL | -0.211672308 | NULL |
| Ulixertinib | MAPK3 | 0 | -2.512322 | 0.0032 | -0.350073519 | NULL | -0.122930226 | NULL |
| GSK1904529A | IGF1R | -0.48926 | -2.473885 | 0.0279 | -1.324925212 | NULL | -0.418323741 | NULL |
| GSK1904529A | INSR | -0.48926 | -2.473885 | -0.0044 | 1.138324276 | NULL | -0.144982834 | NULL |
| LJI308 | RPS6KA2 | 0 | -2.059636 | -0.0165 | -0.925383688 | NULL | 0.219697705 | NULL |
| LJI308 | RPS6KA3 | 0 | -2.059636 | 0.0217 | 0.401757493 | NULL | 0 | NULL |
| XMD14-99 | ALK | -2.017441 | 0 | -0.8008 | 1.40284809 | NULL | -0.151042355 | NULL |
| XMD14-99 | LTK | -2.017441 | 0 | -0.0736 | 4.168525979 | NULL | 0.130334181 | NULL |
| Refametinib | MAP2K1 | -2.684568 | 0 | -0.0647 | 0.385986599 | NULL | -0.251666558 | NULL |
| CI-1040 | MAP2K1 | -3.061957 | 0 | -0.0647 | 0.385986599 | NULL | -0.251666558 | NULL |
| Selumetinib | MAP2K1 | -2.350468 | 0 | -0.0647 | 0.385986599 | NULL | -0.251666558 | NULL |
| Refametinib | MAP2K2 | -2.684568 | 0 | -0.0044 | 0.354334418 | NULL | -0.211672308 | NULL |
| CI-1040 | MAP2K2 | -3.061957 | 0 | -0.0044 | 0.354334418 | NULL | -0.211672308 | NULL |
| Selumetinib | MAP2K2 | -2.350468 | 0 | -0.0044 | 0.354334418 | NULL | -0.211672308 | NULL |
| SL0101 | PIM1 | -2.53603 | 0 | -0.0526 | 0.736328775 | NULL | 0.137540582 | NULL |
| SL0101 | PIM3 | -2.53603 | 0 | -0.3425 | -0.113170478 | NULL | -0.350262639 | NULL |
You must be logged in to post a comment.